Analyze every attribute of your bills.
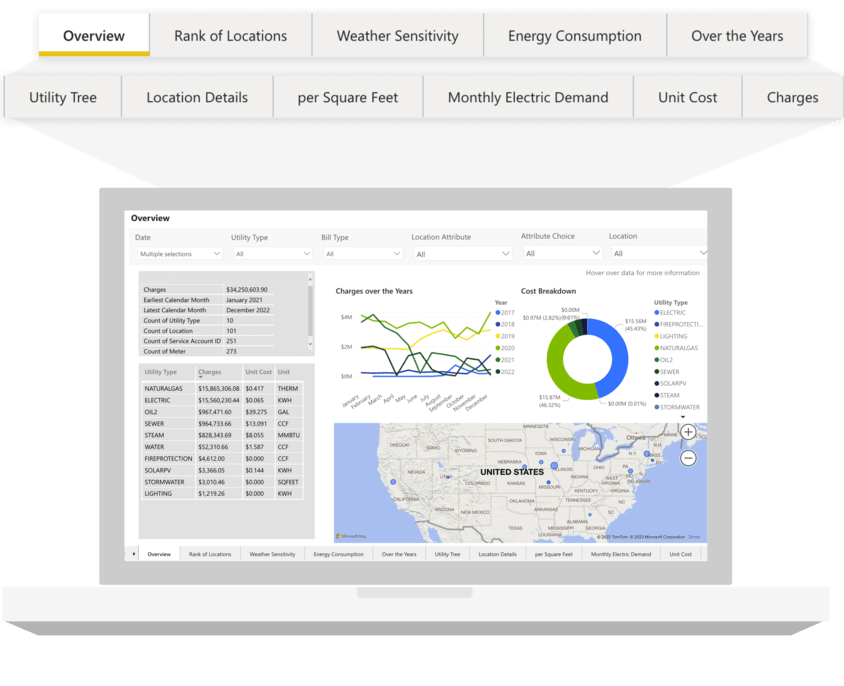
Analytics and Reporting on The Pear.ai Platform will enable you to efficiently identify ways to reduce your bills by alerting you. to inaccuracies, helping you avoid late fees, and alerting you when something looks off.
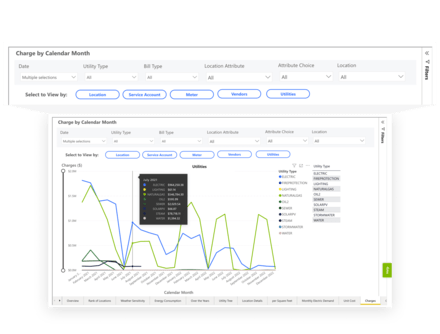
Goodbye Spreadsheets
With Pear.ai, you have access to consolidated utility data from all accounts and meters, saving you time and energy from manual data assembly. Keep using spreadsheets? No problem; all data is exportable. Get reliable data and insights, so you can focus on what matters.

Automate Your Reporting
Choose from a variety of predefined reports.
Reports can be delivered via email or SFTP, with the option to run now or schedule recurring runs.
All data is exportable as a CSV or Excel file for additional analysis.

Are you paying for mistakes?
Stay informed with insights into rate class, late fees, consumption anomalies, and more!

Forensic Accounting at your Fingertips
The platform documents every dollar spent on imported invoices and where it went, allowing you to analyze the money flow quickly and make better-informed decisions.
Actionable insights can save you money.
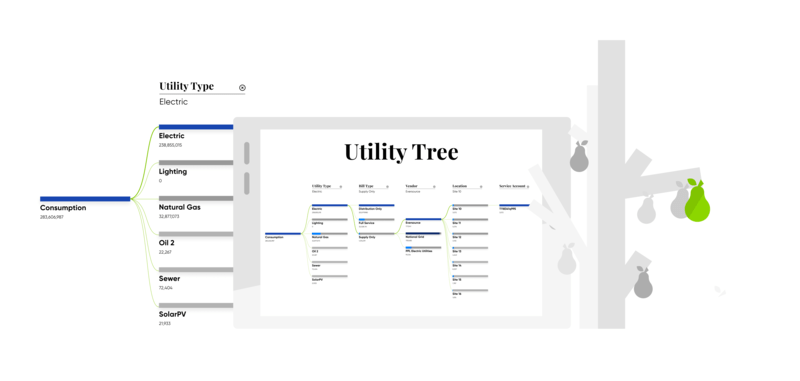
Benchmark Your Buildings
The Metrics view provides an aggregated and calendarized list of your energy costs, with options to view by:
- Kwh
- CCF
- Therms
- MMBTU
Use the "cost per square foot" lens to discover areas for efficiency improvements and focus on what matters most.

Weather Sensitivity Reporting
The Pear.ai Platform’s Weather Sensitivity Report shows:
- If locations are climate-sensitive
- Total Cooling Degree Days (CDD)
- Heating Degree Days (HDD)
- Average monthly consumption vs. degree days
Simplify environmental data management and focus on what matters.

Create future-year budget forecasts.
- Historical cost and consumption information to create future-year budget forecasts.
- Customizable budgeting reports.
- Numerous filtering options allow you to aggregate the data into information your company needs.

Explore All Analytics and Reporting Features
